
It's hot in the city: understanding the urban heat island effect on Ohio State's campus
Forty years ago, Ohio State geography Professor John Arnfield would get into his Volkswagen Microbus and set out to study the microclimates in Columbus. His wife, Joan, marked intersections in the city as sensors mounted on top of the vehicle and a strip chart recorder kept track of the decreasing temperature from the urban settings of campus and downtown toward Scioto Downs, a horseracing track in a rural area south of the city.
The temperature was lower in the rural areas because of the urban heat island effect, which results from factors including activity in the city, buildings and roads and their materials, and lack of green infrastructure.
Now, Jim DeGrand, a senior researcher in geography and assistant state climatologist, and colleagues from Byrd Polar and Climate Research Center; university Planning, Architecture and Real Estate; and the Sustainability Institute at Ohio State are determining what the urban heat island effect means for Ohio State. By classifying climate zones at the Columbus campus and installing a sensor network to monitor and measure the heat island effect, the team expects to explore ways to reduce its impact.
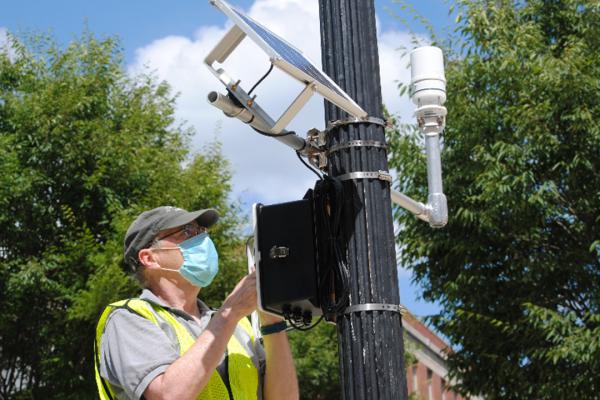
“This effect, while it isn’t often the first thing that people think about in the context of the urban heat island,” says DeGrand (photo: above, installing a sensor station on campus), “is significant for human comfort and health — think about how cities remain quite warm in the evenings during heat waves — and also for energy consumption since large daily temperature ranges place higher demands on building HVAC services.”
Human comfort and health factor into quality of life, a category for improvement measured in the university’s sustainability goals. Data related to the urban heat island effect will feed into metrics in Ohio State’s unique Ecosystem Services Index, which defines categories for campus improvement toward the goal of increasing campus ecosystem services, benefits that society receives from the natural environment, by 60 percentage points by 2025.
Under certain conditions — say, a day with calm winds and relatively clear skies — those actual temperatures can differ more than you might think across relatively small distances. Consider the Broad and High streets intersection in downtown Columbus versus the rural Madison County line 13 miles west of the city. Take a guess at the temperature span. 2 degrees Farenheit? 3? Maybe even 5?
Try 14. That’s what DeGrand and his students found in 2012 when they conducted a study similar to Arnfield’s but with more modern tools — an electronic datalogger and a GPS tracker.
“That’s a massive, massive difference,” says DeGrand. He says although the temperature variation isn’t normally quite that pronounced, Columbus often takes a spot among U.S. cities having the largest daytime urban heat island effect.
Learn how these researchers are using campus as a lab by reading the full story at The Sustainability Institute.
This story originally appeared in The Sustainability Institute News on August 10, 2020.